Obervability
Services
AudiTrace
Resources▾
Contact
Book a free audit
AudiTrace
Audit your Dynatrace tenant. In one run.
71 checks across configuration, security, coverage and cost. Every finding comes with the source behind it and its yearly cost. Read-only, always.
Book a free audit
See the 71 checks
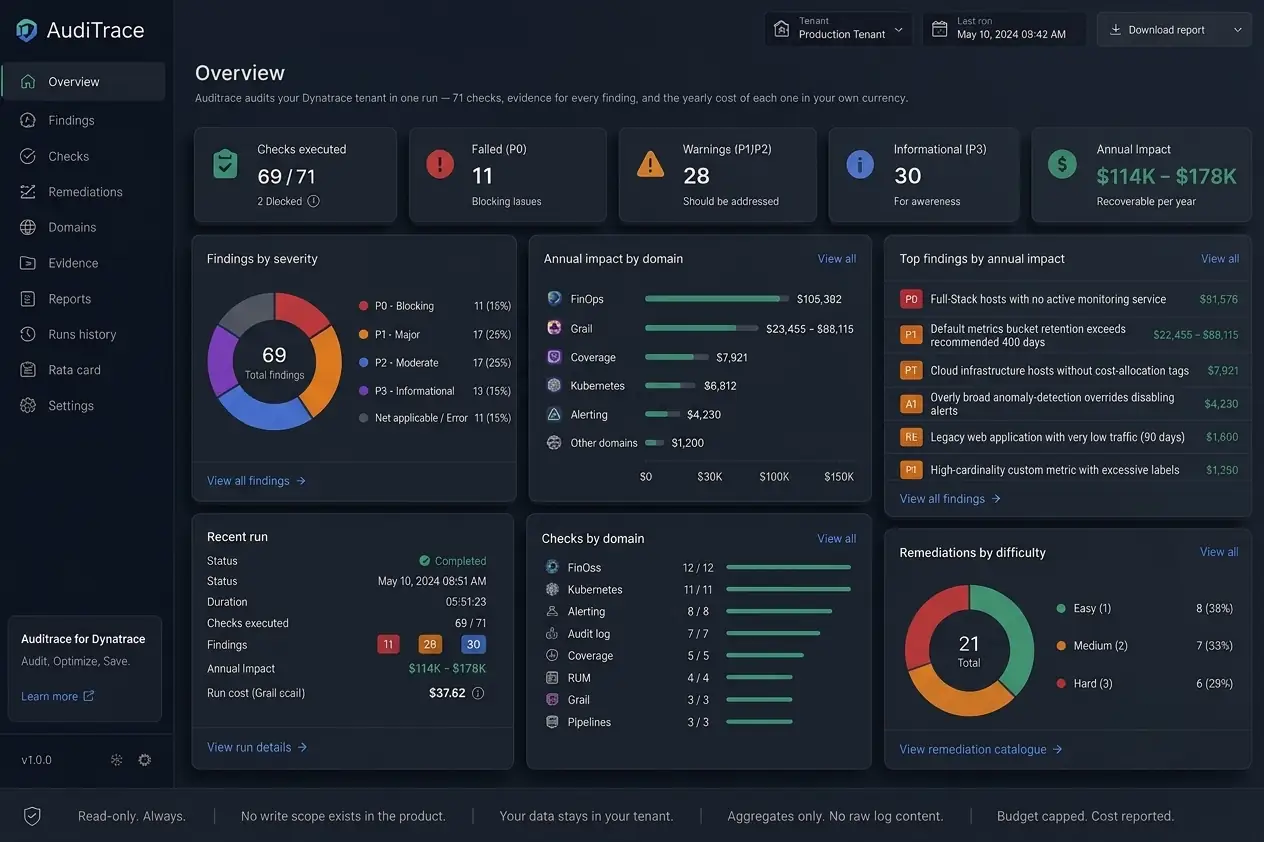
Measured, not estimated
Every finding carries the exact source behind it and a CSV of the objects it found.
Priced with your rate card
Savings are computed from your negotiated rates, not from list price.
Read-only, always
No write scope exists in the product. Nothing is created, changed, or deleted.
You are paying for observability. Is it observing?
Full-Stack hosts, infrastructure data
You pay the Full-Stack rate and receive infrastructure data. On one production tenant: 140 hosts.
$91,576 / year
Retention nobody chose
A default Grail bucket sitting at 462 days because it was never reviewed. Storage is billed per day, per gigabyte, forever.
462 days
Alerting that does not alert
Notifications pointing at a deleted alerting profile fail silently. Maintenance windows set once and still open years later.
1,617 windows
Personal data in cleartext logs
Email addresses landing in Grail because no masking rule was ever applied.
50 sources · ~30.7M/day
How it works
01
Connect
Read-only, through your existing SSO session. No token to create, no credential to hand over, no network path to open.
02
Run
71 checks execute against your tenant. A hard budget cap limits how much Grail data may be scanned; the run stops rather than exceed it.
03
Read
A report, an Excel workbook, and one evidence CSV per finding.
From a workstation
Audit engagement
The auditor runs the engine under your SSO session. No token to create, no install on the tenant, no network path to open.
From inside your tenant
AudiTrace for Dynatrace — native app
The engine deployed as a native Dynatrace app. Your own team runs the audit whenever they want, without an external party connecting.
Two ways to run it, one engine: every check declares both paths and produces the same verdict whichever transport is used.
What a finding contains
The money
Where it can be computed — annualized.
Business value
What the finding means in the business's own terms — what it saves, what it exposes, and what it costs to leave alone.
The evidence
A CSV listing the objects found, so remediation has a work list.
The verdict
Every one of the 71 checks comes back with a status of its own — pass, warning, fail, not applicable or error. Never a guess.
The trigger condition
The literal expression that decided the verdict.
The remediation
Which of the 21 catalogued fixes applies, its difficulty, and whether it can be automated.
What you receive
The report
Scored findings by domain and severity, each with its remediation, difficulty and — where computable — its annualized cost.
The Excel workbook
Every finding as structured data, ready for filtering, ownership assignment and progress tracking.
Evidence CSVs
One CSV per finding listing the exact objects found — so remediation starts from a work list, not a search.
The 71 checks
71 active checks across 19 domains. A check that cannot run reports blocked or not applicable — it never reports a pass it could not prove.
Security and trust
Read-only is enforced, not promised
No write scope exists in the product — not disabled, absent. The runner aborts if the connected context is not the intended tenant or the session is not read-only.
Your data does not leave
Aggregates only: queries on logs, spans and business events return counts and field names, not message bodies. Where a check has to match on content — personal data in logs is the one that does — it counts the matches and returns the count, and anything personal is anonymized before a human reads it.
Cost is bounded before the run
Every Grail query carries a server-side scan cap. A run has a hard budget ceiling and stops rather than exceed it. The audit reports its own cost.
Every line in the report is backed
Every finding carries its scale, its annual cost and the source behind it. That is why a single row can go straight into a budget conversation, or into the quarter’s plan, without explaining where the number came from.
Not a monitoring tool — it audits your Dynatrace configuration.
Not a replacement for Dynatrace support or your account team.
Not an agent, not a sidecar, not a daemon. It runs when you run it, and stops.
Ways to work with us
One-off
Configuration, security and cost audit
71 checks, complete report, prioritized remediation plan, findings review session. Nothing installed on your tenant. Read-only throughout.
Free of charge.
Book a free audit →Monthly
Compliance and cost monitoring
Monthly audit run, change analysis against the previous month, remediation support, monthly review. The deliverable is remediation progress — the report is the evidence.
Sold in days per month.
The app
AudiTrace for Dynatrace
The audit engine as a native app in your own environment. Your team runs the audit whenever they want, without an external party connecting to the tenant.
Licensed per tenant, per year. Quote on request.
Frequently asked questions
Does it modify anything in our tenant?
No. There is no write path in the product. It reads, and it stops.
Do we have to install something?
No, for the audit engagement — it runs from the auditor’s workstation under your SSO session. Yes, optionally, if you want the native app so your own team can run it.
Do you see our logs?
We scan logs to find personal data that was stored in them by accident — that is exactly what the check is for: to hand you the list so you can mask it. What comes back is a count per source: how many records, and of what kind. The log content itself is never retrieved or retained.
Can we verify the findings ourselves?
Yes, and you should. Every finding ships with the exact condition that decided its verdict and the list of objects behind it. Another AudiTrace run returns the same number — that is how you check it.
How are savings calculated?
From your own contract rates, which you provide. If you do not provide them we price on the vendor’s list rate and say so explicitly in the report, so it is always clear what basis a number stands on.
Find out what your Obervability is actually doing.
An audit takes one run. The findings take one meeting. What you do with them is up to you.
Certified Dynatrace experts
+1
Obervability
Dynatrace implementation, managed services and support. Every finding comes with the source behind it.
Services
Services
AudiTrace
Case study
Guides
Dynatrace audit
Dynatrace cost optimization
Audit case study
Articles
Reach us
Contact
hello@obzervability.com
© 2026 Obervability · All rights reserved.
Privacy
Terms of use
Accessibility
Obervability
{{ t.navServices }}
AudiTrace
{{ resLabel }}▾
{{ t.navContact }}
{{ footGuideAudit }}
{{ footGuideCost }}
{{ footGuideCase }}
{{ footGuideArticles }}
{{ langLabel }} ▾
English
{{ altLabel }}
{{ t.heroKicker }}
{{ t.heroTitle }}
{{ t.heroSub }}
{{ t.heroCta1 }}
{{ t.heroCta2 }}
{{ t.badge }}
71
{{ t.stripChecks }}
19
{{ t.stripDomains }}
21
{{ t.stripRem }}
0
{{ t.stripWrite }}
{{ t.svcTitle }}
{{ t.s1t }}
{{ t.s1d }}
{{ t.s2t }}
{{ t.s2d }}
{{ t.s3t }}
{{ t.s3d }}
{{ t.caseKicker }}
{{ t.caseTitle }}
{{ t.caseCtx }}
{{ t.caseNote }}
{{ t.svcKick }}
{{ t.svcTitle2 }}
{{ t.svcSub }}
{{ t.heroCta1 }}
{{ t.svcCta2 }}
71
{{ t.svcL1 }}
$114–178k
{{ t.svcL2 }}
0
{{ t.svcL3 }}
{{ t.svcTracksT }}
{{ t.svcTracksD }}
{{ k.t }}
{{ k.g }}
{{ k.d }}
{{ t.fcTitle }}
{{ t.svcFindD }}
{{ f.t }}
{{ f.d }}
{{ t.svcEngT }}
{{ t.colEng }}
{{ t.colTrack }}
{{ t.colShape }}
{{ e.n }}
{{ e.k }}
{{ e.s }}
{{ t.svcCtaT }}
{{ t.svcCtaD }}
{{ g.kicker }}
{{ g.title }}
{{ g.sub }}
{{ g.cta1 }}
{{ g.cta2 }}
{{ g.s1h }}
{{ p.t }}
{{ g.s2h }}
{{ g.s2sub }}
{{ c.t }}
{{ c.d }}
{{ g.s3h }}
{{ g.s3sub }}
{{ g.s4h }}
{{ g.s4sub }}
{{ g.tableNote }}
{{ g.s5h }}
{{ g.s5sub }}
{{ k.t }}
{{ k.d }}
{{ g.s6h }}
{{ c.t }}
{{ c.d }}
{{ g.faqH }}
{{ f.q }}
{{ f.a }}
{{ g.closerT }}
{{ g.closerD }}
{{ g.cta1 }}
{{ g.closerCta }}
{{ g.kicker }}
{{ g.title }}
{{ g.sub }}
{{ g.cta1 }}
{{ g.cta2 }}
{{ g.s1h }}
{{ p.t }}
{{ g.s2h }}
{{ g.s2sub }}
{{ g.tableNote }}
{{ g.s3h }}
{{ c.t }}
{{ c.d }}
{{ g.s4h }}
{{ c.t }}
{{ c.d }}
{{ g.faqH }}
{{ f.q }}
{{ f.a }}
{{ g.closerT }}
{{ g.closerD }}
{{ g.cta1 }}
{{ g.closerCta }}
{{ dom.kicker }}
{{ dom.title }}
{{ dom.lede }}
{{ dom.ctaBook }}
{{ dom.ctaChecks }}
{{ dom.hReads }}
{{ r.t }}
{{ r.d }}
{{ dom.hWhy }}
{{ p.t }}
{{ dom.findLabel }}
{{ dom.findName }}
{{ dom.lblScale }}
{{ dom.findScale }}
{{ dom.lblImpact }}
{{ dom.findImpact }}
{{ dom.findNote }}
{{ dom.hFaqs }}
{{ f.q }}
{{ f.a }}
{{ dom.hOther }}
{{ dom.otherSub }}
{{ dom.closerT }}
{{ dom.closerD }}
{{ dom.ctaBook }}
{{ dom.closerCta }}
{{ c.kicker }}
{{ c.title }}
{{ c.sub }}
{{ c.cta1 }}
{{ c.cta2 }}
{{ f.n }}
{{ f.l }}
{{ c.s1h }}
{{ c.s1sub }}
{{ c.tableNote }}
{{ c.s2h }}
{{ p.t }}
{{ c.s3h }}
{{ a.t }}
{{ a.d }}
{{ c.s4h }}
{{ f.q }}
{{ f.a }}
{{ c.closerT }}
{{ c.closerD }}
{{ c.cta1 }}
{{ c.closerCta }}
{{ art.kicker }}
{{ art.title }}
{{ art.dek }}
{{ art.dateLine }}
{{ s.h }}
{{ p.t }}
DQL
{{ s.code }}
{{ art.findLabel }}
{{ art.findName }}
{{ art.scaleLabel }}
{{ art.findScale }}
{{ art.impactLabel }}
{{ art.findImpact }}
{{ art.takeawayLabel }}
{{ art.takeaway }}
{{ art.moreLabel }}
{{ art.ctaTitle }}
{{ art.ctaSub }}
{{ art.ctaBtn }}
AudiTrace
{{ artIndexKicker }}
{{ artIndexTitle }}
{{ artIndexSub }}
{{ t.privTitle }}
{{ t.privUpdated }}
{{ s.h }}
{{ s.b }}
{{ t.termsTitle }}
{{ t.termsUpdated }}
{{ s.h }}
{{ s.b }}
{{ t.a11yTitle }}
{{ t.a11yUpdated }}
{{ s.h }}
{{ s.b }}
{{ c.t }}
{{ c.d }}
{{ t.pTitle }}
{{ p.t }}
{{ p.d }}
{{ p.fig }}
{{ t.hTitle }}
{{ s.n }}
{{ s.t }}
{{ s.d }}
{{ t.way1k }}
{{ t.way1t }}
{{ t.way1d }}
{{ t.way2k }}
{{ t.way2t }}
{{ t.way2d }}
{{ t.waysNote }}
{{ t.fcTitle }}
{{ i.t }}
{{ i.d }}
{{ t.prDelTitle }}
{{ d.t }}
{{ d.d }}
{{ t.dTitle }}
{{ t.dSub }}
{{ t.secTitle }}
{{ b.t }}
{{ b.d }}
{{ n.t }}
{{ t.oTitle }}
{{ o.k }}
{{ o.t }}
{{ o.d }}
{{ o.p }}
{{ t.faqTitle }}
{{ q.q }}
{{ q.a }}
{{ t.cTitle }}
{{ t.cSub }}
{{ t.badge }}
{{ t.fSentT }}
{{ t.fSentD }}
{{ ccDial }}
{{ formErrMsg }}
{{ t.footColServices }}
{{ t.navServices }}
AudiTrace
{{ t.navCase }}
{{ t.footColGuides }}
{{ footGuideAudit }}
{{ footGuideCost }}
{{ footGuideCase }}
{{ footGuideArticles }}
{{ t.footColReach }}
{{ t.navContact }}
hello@obzervability.com
© 2026 Obzervability · {{ t.footRights }}
{{ t.navPrivacy }}
{{ t.navTerms }}
{{ t.navA11y }}