Obervability
Services
AudiTrace
Resources▾
Contact
Book a free audit
Dynatrace audit
What a Dynatrace audit finds — and what it costs you not to run one.
An audit reads your tenant end to end and reports what is actually configured, what is actually monitored, and what each of those choices is costing per year. One run, read-only, with the source behind every line.
Book a free audit
See the 71 checks
What a Dynatrace audit is
A Dynatrace audit is a systematic, read-only review of a Dynatrace tenant: its configuration, its monitoring coverage, its alerting behaviour, its data retention and its consumption. It answers three questions a dashboard cannot — is everything that matters actually monitored, would a real incident actually reach a human, and what is each of those choices costing per year.
The distinction matters. A dashboard reports the state of what it was pointed at. An audit reports what it was never pointed at: the Full-Stack host with no monitored service on it, the alerting profile that was deleted while notifications still reference it, the retention nobody chose. Those are absences, and absences do not appear on a chart.
It is also not a support ticket or a health check in the vendor sense. Nothing is changed, nothing is installed, and no finding arrives as an opinion — each one carries the exact source behind it, the list of objects it matched, and, where it can be computed, its annualized cost on your own rate card. All of it is done with AudiTrace, a tool we built for the job, which runs the same 71 checks in the same order on every tenant — so the result is a function of what you have, not of who looked and on which day.
Six signs it is time to run one
None of these are unusual. Most tenants collect several of them within two years of going live, because the people who made the original decisions have moved on and the decisions have not.
The bill grew faster than the estate
Host count went up 20% and the invoice went up 60%. Something other than growth is consuming — usually retention, ingest, or hosts running a mode nothing on them needs.
Nobody can say why a host is Full-Stack
The mode was set at rollout, by a template, and never revisited. Some of those hosts have no monitored service on them at all.
Incidents are still found by customers
Alerts fire, and yet the first report comes from outside. Usually maintenance windows, anomaly-detection overrides, or notifications pointing at a profile that no longer exists.
An admin left, and the tokens stayed
Nobody has an inventory of what tokens exist, what scopes they hold, or which of them have not been used in a year.
A renewal or a DPS move is coming
You need a defensible number for the negotiation, not a vendor estimate, and you need it tied to objects you can point at.
Retention was set once, in a hurry
Default buckets are generous. A default left in place for two years is one of the largest single line items we find, and it was never a decision.
What it covers — 19 domains, 71 checks
A check that cannot run reports blocked or not applicable. It never reports a pass it could not prove.
What one audit found
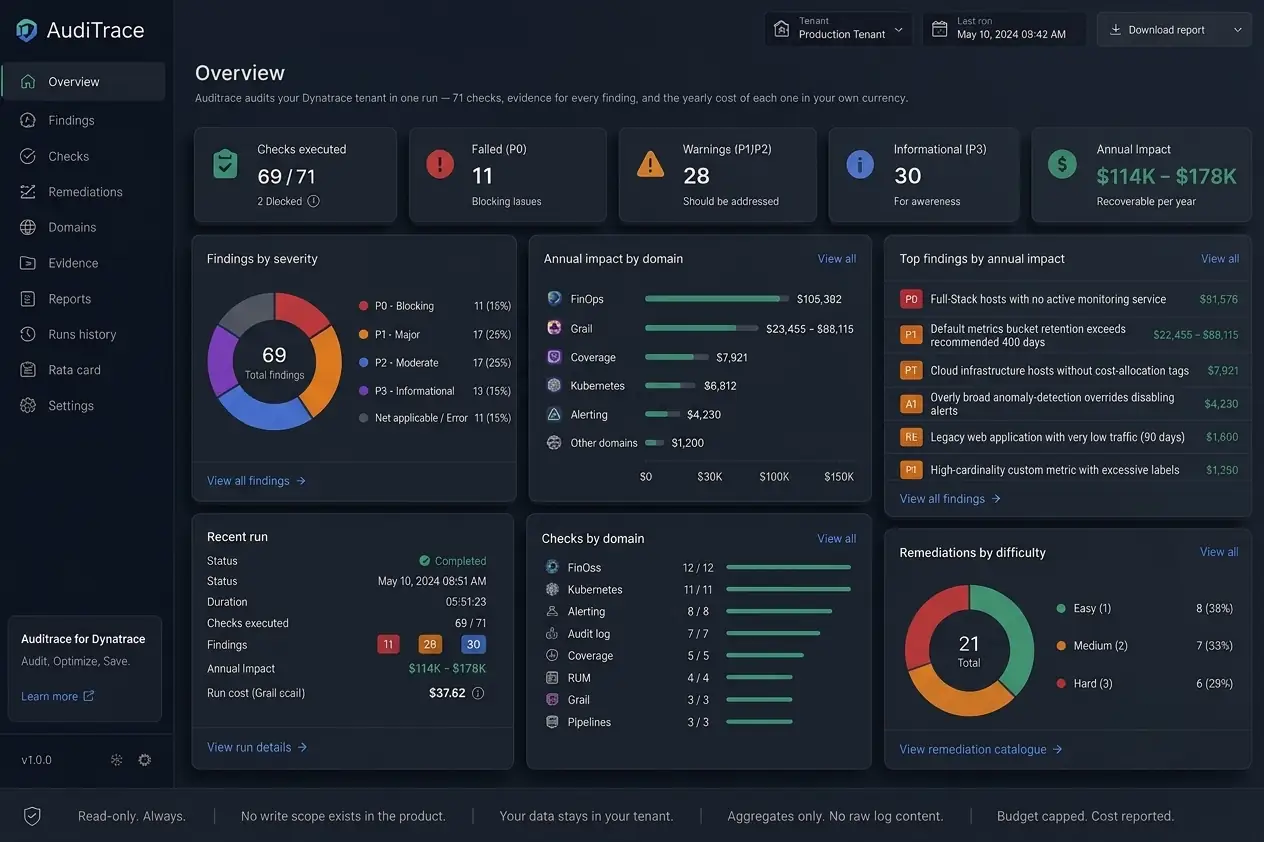
One customer, a very large shipping company, anonymized: several thousand hosts, 100+ applications, multiple Kubernetes clusters. 69 of 71 checks completed; 2 were blocked by server-side caps and reported as blocked.
Computed with that client’s negotiated rate card, not list price. The range on retention reflects a decision that was theirs to make. A cost is never added to a saving.
What you actually receive
Not a slide deck. A finding is the unit of work, and every one of them has the same four parts.
The annual cost
Priced on your negotiated rate card. A cost is never added to a saving.
Business value
What the finding means in your own terms — what it saves, what it exposes, and what it costs to leave alone.
The object list
Every affected entity, as a CSV. Not a count — the actual rows.
The verdict
Every one of the 71 checks comes back with a status of its own — pass, fail, blocked or not applicable. A check that cannot run never reports a pass it could not prove.
How it runs
A SaaS application, nothing to install
AudiTrace is a SaaS application. There is nothing to install and nothing to deploy: it connects to your tenant under your own SSO session, scans it, and produces the report. Nothing is left in the tenant afterwards and no network path has to be opened.
Read-only, by construction
There is no write path in the engine. It reads configuration and queries data, and it stops. Nothing in your tenant changes because an audit ran.
Your team can run it instead
The same engine ships as a native Dynatrace app. Every check declares both routes and returns the same verdict either way, so nobody outside your organisation has to connect at all.
Log content is never read
Queries against logs, spans and business events return counts and field names. Message bodies and payloads are not retrieved, and not stored.
Questions we get asked first
How long does a Dynatrace audit take?
One run. The engine completes on its own; reading the findings and agreeing what to do about them takes a meeting. There is no discovery phase and no questionnaire.
Does it need write access to our tenant?
No. It runs under a session that can only read configuration and query data. No write scope is requested, and there is no write path in the engine to use one.
Is this a Dynatrace product?
No. AudiTrace is ours. It uses documented APIs and DQL, the same interfaces your own team has, which is why every finding can be reproduced without us.
What does the first audit cost?
Nothing. The first run is free and you keep the report regardless of whether you engage us for anything afterwards.
Will it slow the tenant down?
No agent is installed and nothing is deployed. The engine issues ordinary read queries, and where a server-side cap stops one, the check reports blocked rather than retrying against your environment.
What happens to a check that cannot run?
It reports blocked or not applicable, and says which. A check never reports a pass it was unable to prove — two of the 71 came back blocked on the tenant in the case study, and the report said so.
Run it on your own tenant.
The first audit is free, it is read-only, and the report is yours either way.
Book a free audit
See how AudiTrace works
Find out what your Obervability is actually doing.
An audit takes one run. The findings take one meeting. What you do with them is up to you.
Certified Dynatrace experts
+1
Obervability
Dynatrace implementation, managed services and support. Every finding comes with the source behind it.
Services
Services
AudiTrace
Case study
Guides
Dynatrace audit
Dynatrace cost optimization
Audit case study
Articles
Reach us
Contact
hello@obzervability.com
© 2026 Obervability · All rights reserved.
Privacy
Terms of use
Accessibility
Obervability
{{ t.navServices }}
AudiTrace
{{ resLabel }}▾
{{ t.navContact }}
{{ footGuideAudit }}
{{ footGuideCost }}
{{ footGuideCase }}
{{ footGuideArticles }}
{{ langLabel }} ▾
English
{{ altLabel }}
{{ t.heroKicker }}
{{ t.heroTitle }}
{{ t.heroSub }}
{{ t.heroCta1 }}
{{ t.heroCta2 }}
{{ t.badge }}
71
{{ t.stripChecks }}
19
{{ t.stripDomains }}
21
{{ t.stripRem }}
0
{{ t.stripWrite }}
{{ t.svcTitle }}
{{ t.s1t }}
{{ t.s1d }}
{{ t.s2t }}
{{ t.s2d }}
{{ t.s3t }}
{{ t.s3d }}
{{ t.caseKicker }}
{{ t.caseTitle }}
{{ t.caseCtx }}
{{ t.caseNote }}
{{ t.svcKick }}
{{ t.svcTitle2 }}
{{ t.svcSub }}
{{ t.heroCta1 }}
{{ t.svcCta2 }}
71
{{ t.svcL1 }}
$114–178k
{{ t.svcL2 }}
0
{{ t.svcL3 }}
{{ t.svcTracksT }}
{{ t.svcTracksD }}
{{ k.t }}
{{ k.g }}
{{ k.d }}
{{ t.fcTitle }}
{{ t.svcFindD }}
{{ f.t }}
{{ f.d }}
{{ t.svcEngT }}
{{ t.colEng }}
{{ t.colTrack }}
{{ t.colShape }}
{{ e.n }}
{{ e.k }}
{{ e.s }}
{{ t.svcCtaT }}
{{ t.svcCtaD }}
{{ g.kicker }}
{{ g.title }}
{{ g.sub }}
{{ g.cta1 }}
{{ g.cta2 }}
{{ g.s1h }}
{{ p.t }}
{{ g.s2h }}
{{ g.s2sub }}
{{ c.t }}
{{ c.d }}
{{ g.s3h }}
{{ g.s3sub }}
{{ g.s4h }}
{{ g.s4sub }}
{{ g.tableNote }}
{{ g.s5h }}
{{ g.s5sub }}
{{ k.t }}
{{ k.d }}
{{ g.s6h }}
{{ c.t }}
{{ c.d }}
{{ g.faqH }}
{{ f.q }}
{{ f.a }}
{{ g.closerT }}
{{ g.closerD }}
{{ g.cta1 }}
{{ g.closerCta }}
{{ g.kicker }}
{{ g.title }}
{{ g.sub }}
{{ g.cta1 }}
{{ g.cta2 }}
{{ g.s1h }}
{{ p.t }}
{{ g.s2h }}
{{ g.s2sub }}
{{ g.tableNote }}
{{ g.s3h }}
{{ c.t }}
{{ c.d }}
{{ g.s4h }}
{{ c.t }}
{{ c.d }}
{{ g.faqH }}
{{ f.q }}
{{ f.a }}
{{ g.closerT }}
{{ g.closerD }}
{{ g.cta1 }}
{{ g.closerCta }}
{{ dom.kicker }}
{{ dom.title }}
{{ dom.lede }}
{{ dom.ctaBook }}
{{ dom.ctaChecks }}
{{ dom.hReads }}
{{ r.t }}
{{ r.d }}
{{ dom.hWhy }}
{{ p.t }}
{{ dom.findLabel }}
{{ dom.findName }}
{{ dom.lblScale }}
{{ dom.findScale }}
{{ dom.lblImpact }}
{{ dom.findImpact }}
{{ dom.findNote }}
{{ dom.hFaqs }}
{{ f.q }}
{{ f.a }}
{{ dom.hOther }}
{{ dom.otherSub }}
{{ dom.closerT }}
{{ dom.closerD }}
{{ dom.ctaBook }}
{{ dom.closerCta }}
{{ c.kicker }}
{{ c.title }}
{{ c.sub }}
{{ c.cta1 }}
{{ c.cta2 }}
{{ f.n }}
{{ f.l }}
{{ c.s1h }}
{{ c.s1sub }}
{{ c.tableNote }}
{{ c.s2h }}
{{ p.t }}
{{ c.s3h }}
{{ a.t }}
{{ a.d }}
{{ c.s4h }}
{{ f.q }}
{{ f.a }}
{{ c.closerT }}
{{ c.closerD }}
{{ c.cta1 }}
{{ c.closerCta }}
{{ art.kicker }}
{{ art.title }}
{{ art.dek }}
{{ art.dateLine }}
{{ s.h }}
{{ p.t }}
DQL
{{ s.code }}
{{ art.findLabel }}
{{ art.findName }}
{{ art.scaleLabel }}
{{ art.findScale }}
{{ art.impactLabel }}
{{ art.findImpact }}
{{ art.takeawayLabel }}
{{ art.takeaway }}
{{ art.moreLabel }}
{{ art.ctaTitle }}
{{ art.ctaSub }}
{{ art.ctaBtn }}
AudiTrace
{{ artIndexKicker }}
{{ artIndexTitle }}
{{ artIndexSub }}
{{ t.privTitle }}
{{ t.privUpdated }}
{{ s.h }}
{{ s.b }}
{{ t.termsTitle }}
{{ t.termsUpdated }}
{{ s.h }}
{{ s.b }}
{{ t.a11yTitle }}
{{ t.a11yUpdated }}
{{ s.h }}
{{ s.b }}
{{ c.t }}
{{ c.d }}
{{ t.pTitle }}
{{ p.t }}
{{ p.d }}
{{ p.fig }}
{{ t.hTitle }}
{{ s.n }}
{{ s.t }}
{{ s.d }}
{{ t.way1k }}
{{ t.way1t }}
{{ t.way1d }}
{{ t.way2k }}
{{ t.way2t }}
{{ t.way2d }}
{{ t.waysNote }}
{{ t.fcTitle }}
{{ i.t }}
{{ i.d }}
{{ t.prDelTitle }}
{{ d.t }}
{{ d.d }}
{{ t.dTitle }}
{{ t.dSub }}
{{ t.secTitle }}
{{ b.t }}
{{ b.d }}
{{ n.t }}
{{ t.oTitle }}
{{ o.k }}
{{ o.t }}
{{ o.d }}
{{ o.p }}
{{ t.faqTitle }}
{{ q.q }}
{{ q.a }}
{{ t.cTitle }}
{{ t.cSub }}
{{ t.badge }}
{{ t.fSentT }}
{{ t.fSentD }}
{{ ccDial }}
{{ formErrMsg }}
{{ t.footColServices }}
{{ t.navServices }}
AudiTrace
{{ t.navCase }}
{{ t.footColGuides }}
{{ footGuideAudit }}
{{ footGuideCost }}
{{ footGuideCase }}
{{ footGuideArticles }}
{{ t.footColReach }}
{{ t.navContact }}
hello@obzervability.com
© 2026 Obzervability · {{ t.footRights }}
{{ t.navPrivacy }}
{{ t.navTerms }}
{{ t.navA11y }}