Obervability
Services
AudiTrace
Resources▾
Contact
Book a free audit
Audit domain · 3 checks
Dynatrace topology audit: entity detection quality and entity explosion
Three checks on the entity model — process-group detection rules producing duplicates, service naming that multiplies entities per deployment, and the growth rate of the entity count itself.
Book a free audit
All 71 checks
What these checks read
Detection rules
Custom process-group and service detection rules, and where they overlap or contradict the defaults.
Entity growth
How the entity count is moving over time, and which detection rule is driving it.
Naming quality
Names carrying build numbers, pod hashes or timestamps — the signature of an entity created fresh on every deploy.
Why it matters
Entity explosion is a slow failure. Each deploy creates a handful of new entities instead of updating the existing ones, dashboards keep working, and a year later a service has 400 historical versions, Davis has no continuity to reason over, and every query is slower than it should be.
The cause is almost always a detection or naming rule that includes something ephemeral. These checks find the rule rather than the symptom: which rule produced the duplicates, how many entities it has created, and what the naming would be without the ephemeral component.
This is also the domain that most often explains a Davis problem that "came out of nowhere". Root-cause attribution depends on entity continuity; break the continuity and the analysis degrades quietly rather than erroring.
Questions we get about this domain
Is a high entity count always a problem?
No — large estates legitimately have large entity counts. The finding is about growth that a detection rule is manufacturing: entities that represent the same thing before and after a deploy. That distinction is what the check reports.
Can you fix the detection rules for us?
Not as part of the audit, which is read-only by design. Rule changes are an implementation engagement, and they need a change window because they rewrite how history joins up.
The other audit domains
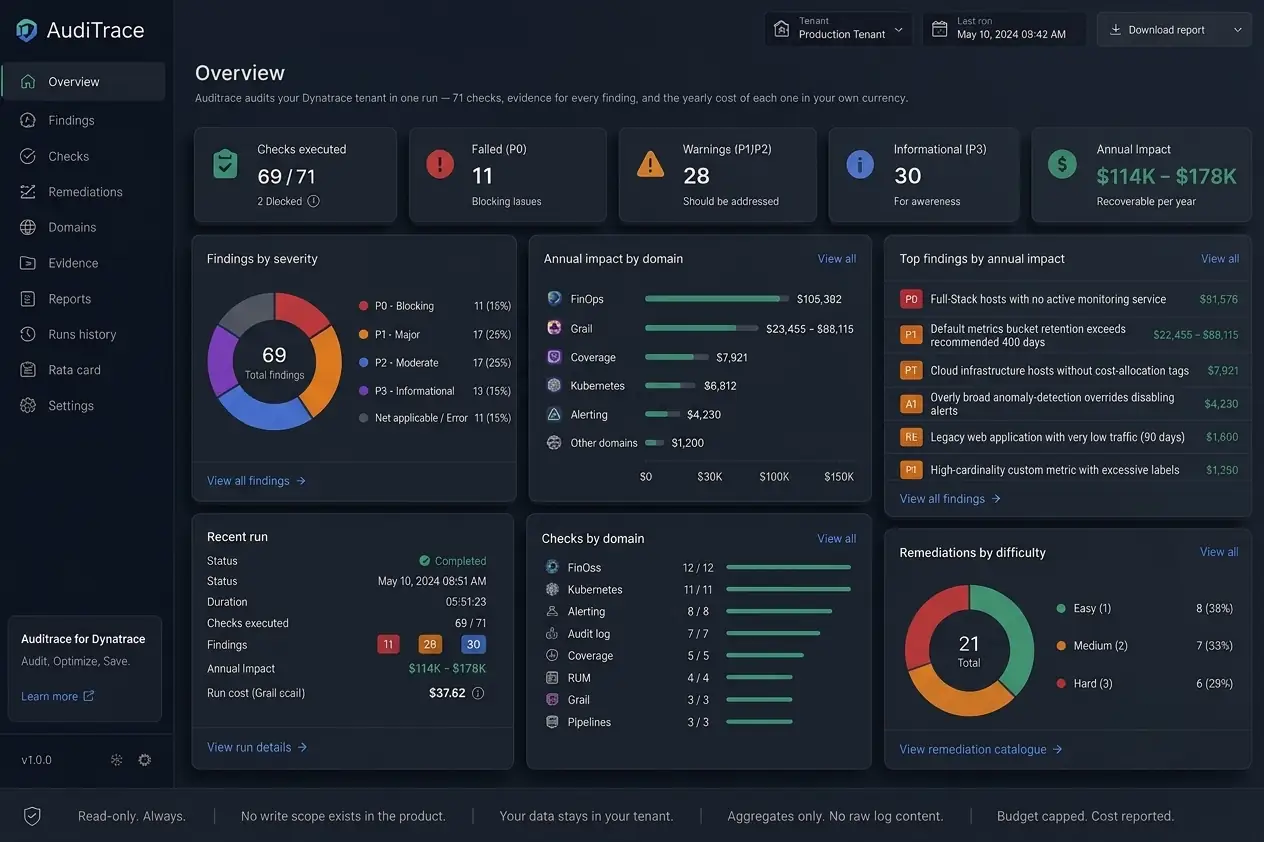
Nineteen domains, 71 checks, one read-only run. Each domain is a page.
FinOps
Where the money goes, and what is recoverable
Kubernetes
Cluster coverage, versions, recurring failures
Alerting
Whether an incident would actually reach a human
Audit log
Who changed what, when, and outside business hours
Coverage
What is monitored, what only looks monitored
RUM
Real-user monitoring reach and privacy settings
Grail
Buckets, retention, annualized storage cost
Pipelines
Ingest processing, masking, drop rules
Synthetic
Synthetic monitors that pass, fail, or never run
Topology
Entity detection quality and entity explosion
OpenTelemetry
OTel sources and dual instrumentation
Security
Token scopes, expiry, dormant credentials
Workflows
Automation that fails or never fires
Bizevents
Business event provider hygiene
Dashboards
Dashboard inventory
Davis
Root-cause attribution rate
OpenPipeline
Route and pipeline resolution
SLO
SLO definitions that break on re-detection
Tagging
Environment tagging convention
See what this domain finds on your own tenant.
One read-only run covers all nineteen domains. You keep the report either way.
Book a free audit
See how AudiTrace works
Find out what your Obervability is actually doing.
An audit takes one run. The findings take one meeting. What you do with them is up to you.
Certified Dynatrace experts
+1
Obervability
Dynatrace implementation, managed services and support. Every finding comes with the source behind it.
Services
Services
AudiTrace
Case study
Guides
Dynatrace audit
Dynatrace cost optimization
Audit case study
Articles
Reach us
Contact
hello@obzervability.com
© 2026 Obervability · All rights reserved.
Privacy
Terms of use
Accessibility
Obervability
{{ t.navServices }}
AudiTrace
{{ resLabel }}▾
{{ t.navContact }}
{{ footGuideAudit }}
{{ footGuideCost }}
{{ footGuideCase }}
{{ footGuideArticles }}
{{ langLabel }} ▾
English
{{ altLabel }}
{{ t.heroKicker }}
{{ t.heroTitle }}
{{ t.heroSub }}
{{ t.heroCta1 }}
{{ t.heroCta2 }}
{{ t.badge }}
71
{{ t.stripChecks }}
19
{{ t.stripDomains }}
21
{{ t.stripRem }}
0
{{ t.stripWrite }}
{{ t.svcTitle }}
{{ t.s1t }}
{{ t.s1d }}
{{ t.s2t }}
{{ t.s2d }}
{{ t.s3t }}
{{ t.s3d }}
{{ t.caseKicker }}
{{ t.caseTitle }}
{{ t.caseCtx }}
{{ t.caseNote }}
{{ t.svcKick }}
{{ t.svcTitle2 }}
{{ t.svcSub }}
{{ t.heroCta1 }}
{{ t.svcCta2 }}
71
{{ t.svcL1 }}
$114–178k
{{ t.svcL2 }}
0
{{ t.svcL3 }}
{{ t.svcTracksT }}
{{ t.svcTracksD }}
{{ k.t }}
{{ k.g }}
{{ k.d }}
{{ t.fcTitle }}
{{ t.svcFindD }}
{{ f.t }}
{{ f.d }}
{{ t.svcEngT }}
{{ t.colEng }}
{{ t.colTrack }}
{{ t.colShape }}
{{ e.n }}
{{ e.k }}
{{ e.s }}
{{ t.svcCtaT }}
{{ t.svcCtaD }}
{{ g.kicker }}
{{ g.title }}
{{ g.sub }}
{{ g.cta1 }}
{{ g.cta2 }}
{{ g.s1h }}
{{ p.t }}
{{ g.s2h }}
{{ g.s2sub }}
{{ c.t }}
{{ c.d }}
{{ g.s3h }}
{{ g.s3sub }}
{{ g.s4h }}
{{ g.s4sub }}
{{ g.tableNote }}
{{ g.s5h }}
{{ g.s5sub }}
{{ k.t }}
{{ k.d }}
{{ g.s6h }}
{{ c.t }}
{{ c.d }}
{{ g.faqH }}
{{ f.q }}
{{ f.a }}
{{ g.closerT }}
{{ g.closerD }}
{{ g.cta1 }}
{{ g.closerCta }}
{{ g.kicker }}
{{ g.title }}
{{ g.sub }}
{{ g.cta1 }}
{{ g.cta2 }}
{{ g.s1h }}
{{ p.t }}
{{ g.s2h }}
{{ g.s2sub }}
{{ g.tableNote }}
{{ g.s3h }}
{{ c.t }}
{{ c.d }}
{{ g.s4h }}
{{ c.t }}
{{ c.d }}
{{ g.faqH }}
{{ f.q }}
{{ f.a }}
{{ g.closerT }}
{{ g.closerD }}
{{ g.cta1 }}
{{ g.closerCta }}
{{ dom.kicker }}
{{ dom.title }}
{{ dom.lede }}
{{ dom.ctaBook }}
{{ dom.ctaChecks }}
{{ dom.hReads }}
{{ r.t }}
{{ r.d }}
{{ dom.hWhy }}
{{ p.t }}
{{ dom.findLabel }}
{{ dom.findName }}
{{ dom.lblScale }}
{{ dom.findScale }}
{{ dom.lblImpact }}
{{ dom.findImpact }}
{{ dom.findNote }}
{{ dom.hFaqs }}
{{ f.q }}
{{ f.a }}
{{ dom.hOther }}
{{ dom.otherSub }}
{{ dom.closerT }}
{{ dom.closerD }}
{{ dom.ctaBook }}
{{ dom.closerCta }}
{{ c.kicker }}
{{ c.title }}
{{ c.sub }}
{{ c.cta1 }}
{{ c.cta2 }}
{{ f.n }}
{{ f.l }}
{{ c.s1h }}
{{ c.s1sub }}
{{ c.tableNote }}
{{ c.s2h }}
{{ p.t }}
{{ c.s3h }}
{{ a.t }}
{{ a.d }}
{{ c.s4h }}
{{ f.q }}
{{ f.a }}
{{ c.closerT }}
{{ c.closerD }}
{{ c.cta1 }}
{{ c.closerCta }}
{{ art.kicker }}
{{ art.title }}
{{ art.dek }}
{{ art.dateLine }}
{{ s.h }}
{{ p.t }}
DQL
{{ s.code }}
{{ art.findLabel }}
{{ art.findName }}
{{ art.scaleLabel }}
{{ art.findScale }}
{{ art.impactLabel }}
{{ art.findImpact }}
{{ art.takeawayLabel }}
{{ art.takeaway }}
{{ art.moreLabel }}
{{ art.ctaTitle }}
{{ art.ctaSub }}
{{ art.ctaBtn }}
AudiTrace
{{ artIndexKicker }}
{{ artIndexTitle }}
{{ artIndexSub }}
{{ t.privTitle }}
{{ t.privUpdated }}
{{ s.h }}
{{ s.b }}
{{ t.termsTitle }}
{{ t.termsUpdated }}
{{ s.h }}
{{ s.b }}
{{ t.a11yTitle }}
{{ t.a11yUpdated }}
{{ s.h }}
{{ s.b }}
{{ c.t }}
{{ c.d }}
{{ t.pTitle }}
{{ p.t }}
{{ p.d }}
{{ p.fig }}
{{ t.hTitle }}
{{ s.n }}
{{ s.t }}
{{ s.d }}
{{ t.way1k }}
{{ t.way1t }}
{{ t.way1d }}
{{ t.way2k }}
{{ t.way2t }}
{{ t.way2d }}
{{ t.waysNote }}
{{ t.fcTitle }}
{{ i.t }}
{{ i.d }}
{{ t.prDelTitle }}
{{ d.t }}
{{ d.d }}
{{ t.dTitle }}
{{ t.dSub }}
{{ t.secTitle }}
{{ b.t }}
{{ b.d }}
{{ n.t }}
{{ t.oTitle }}
{{ o.k }}
{{ o.t }}
{{ o.d }}
{{ o.p }}
{{ t.faqTitle }}
{{ q.q }}
{{ q.a }}
{{ t.cTitle }}
{{ t.cSub }}
{{ t.badge }}
{{ t.fSentT }}
{{ t.fSentD }}
{{ ccDial }}
{{ formErrMsg }}
{{ t.footColServices }}
{{ t.navServices }}
AudiTrace
{{ t.navCase }}
{{ t.footColGuides }}
{{ footGuideAudit }}
{{ footGuideCost }}
{{ footGuideCase }}
{{ footGuideArticles }}
{{ t.footColReach }}
{{ t.navContact }}
hello@obzervability.com
© 2026 Obzervability · {{ t.footRights }}
{{ t.navPrivacy }}
{{ t.navTerms }}
{{ t.navA11y }}